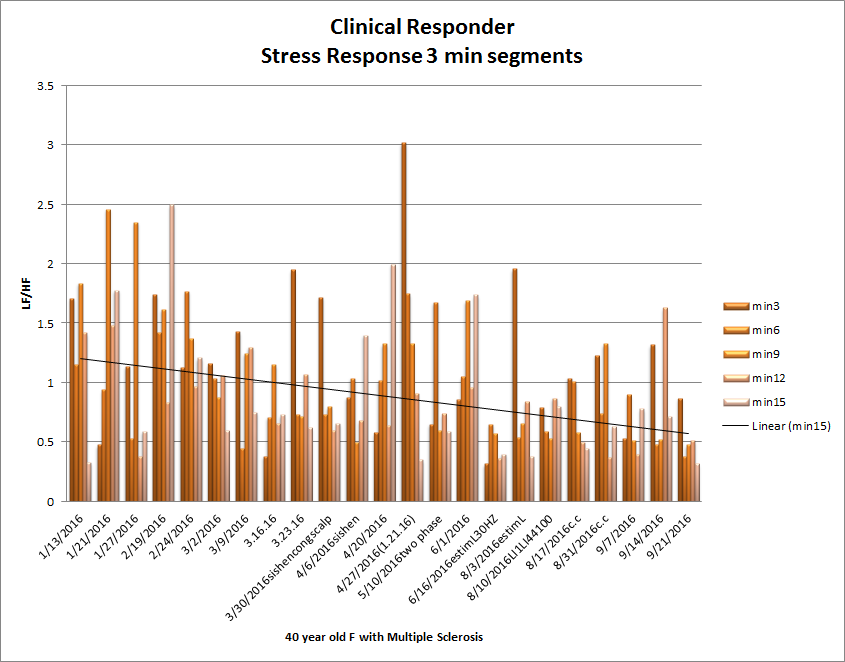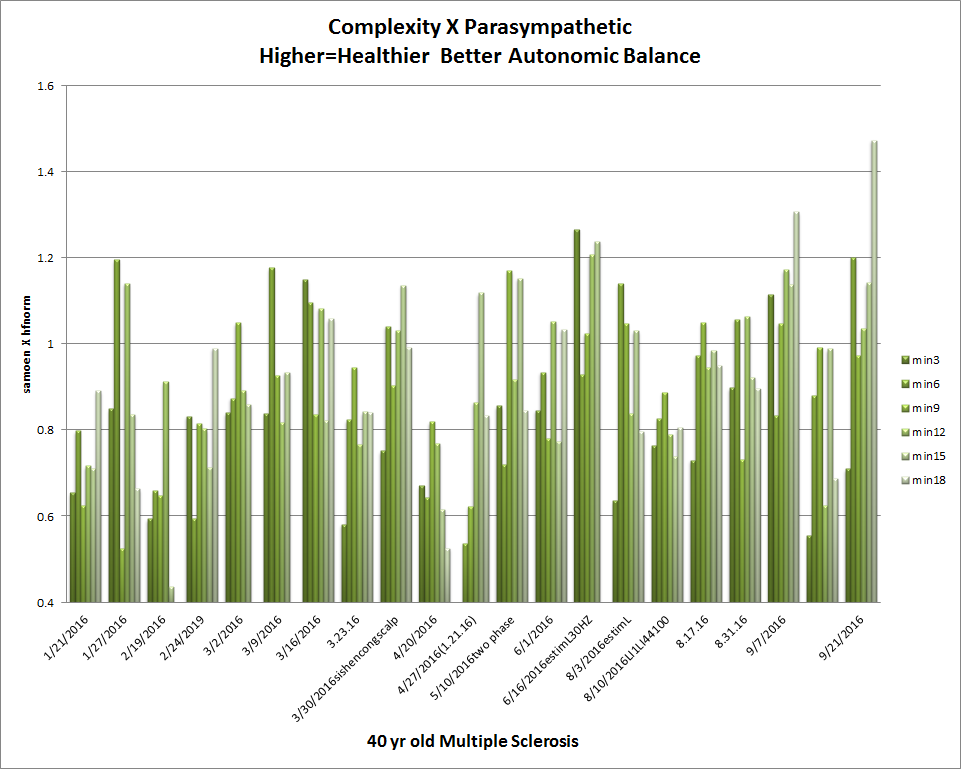

We have discussed this patient who has multiple sclerosis before, but this is her updated data. Keep in mind this is a patient who is presently asymptomatic, and comes in for treatment to lower her stress in order to optimize her immune function. So this data is useful. It shows optimization, ie lower stress over time, so we can SEE optimization.
[Review: HRV is a measure of autonomic balance /stress levels)
Each group of columns represents one clinic visit, each column 3 minutes of data.
I look at each visit for response and also over time (weeks to months).]
This chart looks at her stress levels (LF/HF). LF/HF is a measure of sympathetic activity/parasympathetic activity. Data shows a nice decrease since the beginning of the year.
This data looks at complexity, which is another way to measure autonomic balance combined with parasympathetic activity. What is particularly interesting to me is the last visit, where she had a good spike in these levels. My hunch is that this kind of spike indicates a particularly skillful treatment, or that treatment has reached a new stage.


