Acupuncture for Anxiety, Clinical Case with HRV data Ta.Ta. edition 2
Kristen Sparrow • January 18, 2018


We have seen data from this patient before, but she continues to improve clinically and her data reflects that. I am including four different data sets here. Her HRV (heart rate variability) is good overall. She is young, healthy and active. So when you have overall good variability, the nonlinear data can be especially revealing. If a patient has poor overall variability, as in chronic disease or advanced years, it is best to evaluate linear data that reflects simply sympathetic and parasympathetic activity. These are observations I’ve made over time.
She had good response to TAVNS (called etim in this data) but she didn’t like it, so I stopped trying it.

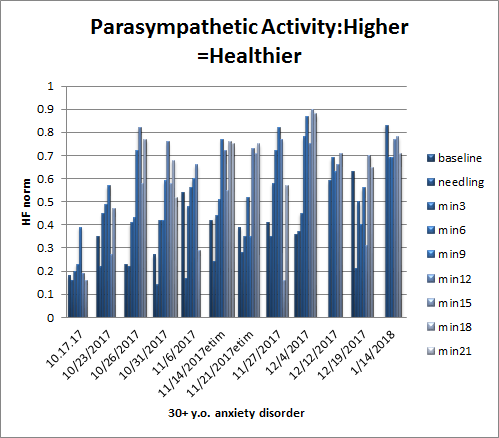
First, parasympathetic activity, or “Rest and Digest”. You would like to see this increase after needling each visit and, ideally, over time.

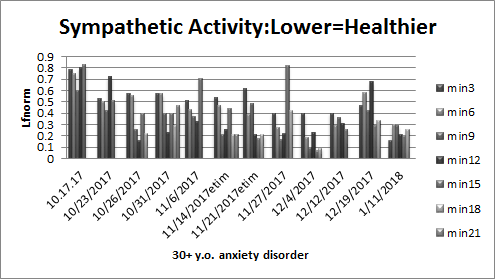
Next, sympathetic activity, or “Fright or Flight”. You would like to see this decrease after needling each visit, and ideally, over time

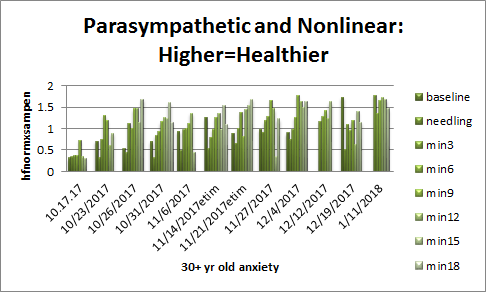
Now for combined parasympathetic and nonlinear data. This can be particularly sensitive and illustrative.

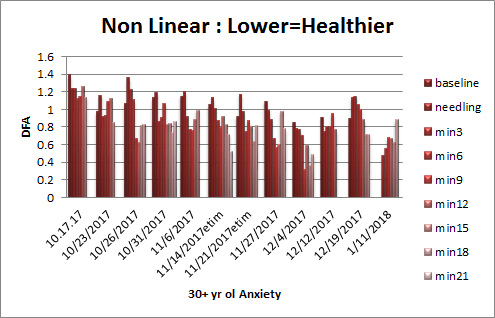
And more nonlinear data, DFAα, which is particularly useful in patients with generally high overall HRV>


